There are ways to extend Datawrapper charts so they can interact with the page around them.
Update charts with user input
Let's take a simple scatterplot.
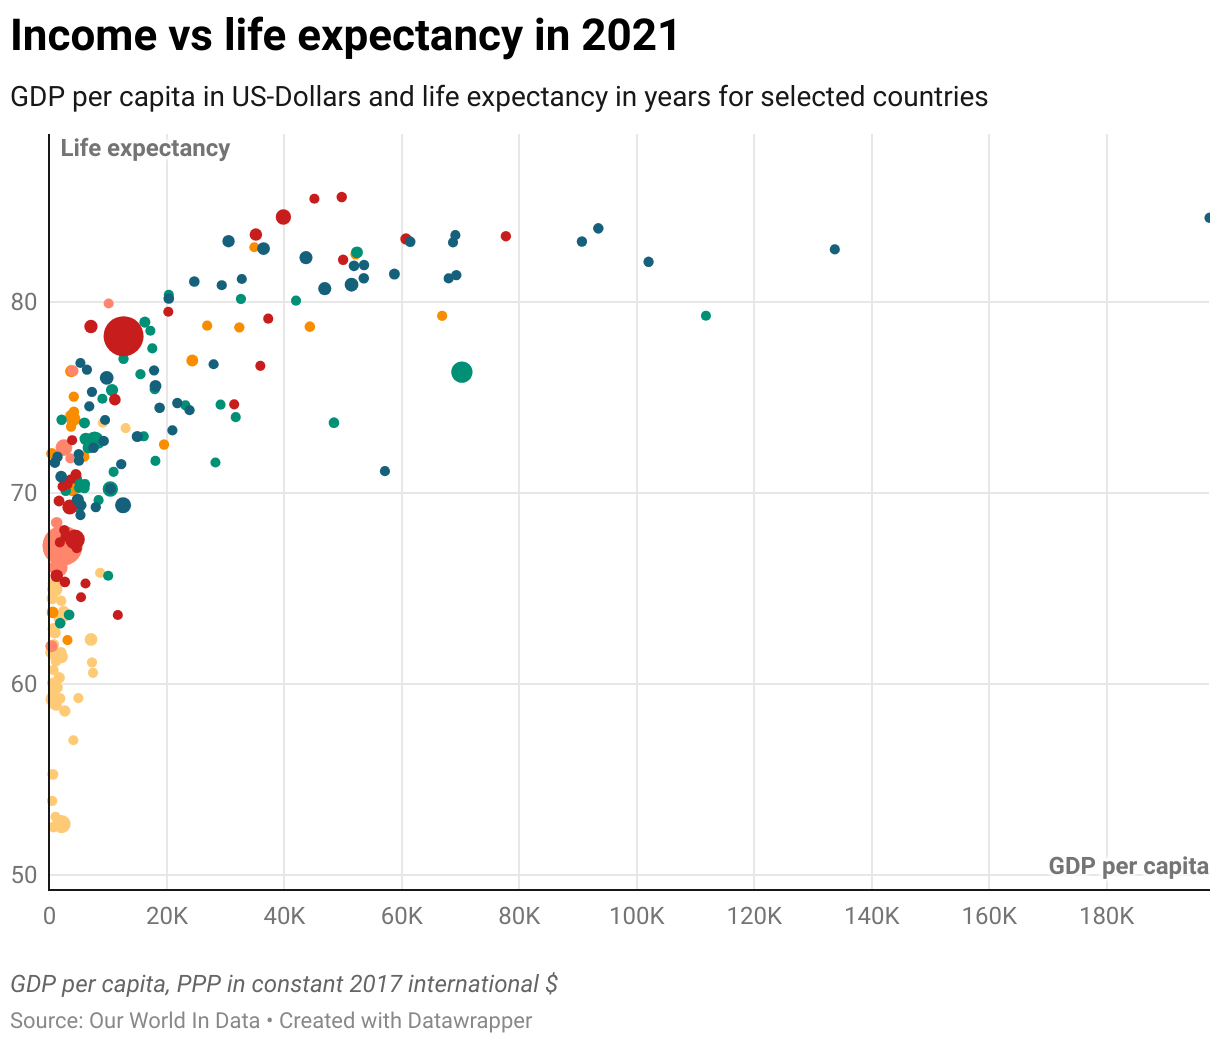
While this is nice and tells a story, it's not ideal for exploring data. Can you easily find your country in the chart? Can you change one of the axis? Can you see how the data changes over time?
While it's a virtually undocumented feature, you can set up Datawrapper to update a chart based on some in-browser triggers, like a button or dropwdown menu.
Instead of the traditional iframes, you need to embed Datawrapper charts with Web Components. This has several advantages, mainly in terms of performance, but for the purposes of this tutorial, it allows us to make changes to the chart based on user input.
First, we'll load some JS code that makes everything possible. Add the following to your HTML file (you can find the full code here):
import {Datawrapper} from '../src/datawrapper.js';
Next, we add the ID of our Datawrapper chart and create it. We'll display the chart later.
const scatterId = 'hhddC';
const scatter = new Datawrapper(scatterId, 'scatter-plot-updateable');
We'll need some form of an input. I'm using the Inputs Observable module to create a nice dropdown menu, but you can crate it with whatever framework you like or in vanilla JS.
import * as Inputs from "npm:@observablehq/inputs";

const countrySelect = view(
  Inputs.select(
    [
      "Afghanistan", "Albania", "Algeria", "Angola", "Antigua and Barbuda", "Argentina", "Armenia", "Aruba", "Australia", "Austria", "Azerbaijan", "Bahamas", "Bahrain", "Bangladesh", "Barbados", "Belarus", "Belgium", "Belize", "Benin", "Bermuda", "Bhutan", "Bolivia", "Bosnia and Herzegovina", "Botswana", "Brazil", "Brunei", "Bulgaria", "Burkina Faso", "Burundi", "Cambodia", "Cameroon", "Canada", "Cape Verde", "Cayman Islands", "Central African Republic", "Chad", "Chile", "China", "Colombia", "Comoros", "Congo", "Costa Rica", "Cote d'Ivoire", "Croatia", "Curacao", "Cyprus", "Czechia", "Democratic Republic of Congo", "Denmark", "Djibouti", "Dominica", "Dominican Republic", "Egypt", "Equatorial Guinea", "Estonia", "Eswatini", "Ethiopia", "Fiji", "Finland", "France", "Gabon", "Gambia", "Ghana", "Greece", "Grenada", "Guatemala", "Guinea", "Guinea-Bissau", "Guyana", "Hong Kong", "Hungary", "Iceland", "India", "Indonesia", "Iraq", "Ireland", "Israel", "Italy", "Jamaica", "Jordan", "Kenya", "Kiribati", "Kyrgyzstan", "Latvia", "Lebanon", "Lesotho", "Liberia", "Libya", "Lithuania", "Luxembourg", "Macao", "Madagascar", "Malawi", "Mali", "Malta", "Marshall Islands", "Mauritius", "Micronesia (country)", "Moldova", "Mongolia", "Montenegro", "Morocco", "Mozambique", "Myanmar", "Namibia", "Nauru", "Nepal", "Netherlands", "New Zealand", "Nicaragua", "Niger", "Nigeria", "North Macedonia", "Oman", "Pakistan", "Palau", "Panama", "Papua New Guinea", "Paraguay", "Peru", "Philippines", "Portugal", "Qatar", "Romania", "Russia", "Rwanda", "Saint Kitts and Nevis", "Saint Lucia", "Saint Vincent and the Grenadines", "Sao Tome and Principe", "Saudi Arabia", "Senegal", "Seychelles", "Sierra Leone", "Singapore", "Slovakia", "Slovenia", "Solomon Islands", "Somalia", "South Africa", "South Korea", "Spain", "Sri Lanka", "Sudan", "Suriname", "Sweden", "Tajikistan", "Tanzania", "Thailand", "Togo", "Tonga", "Trinidad and Tobago", "Tunisia", "Turkey", "Turks and Caicos Islands", "Tuvalu", "Uganda", "Ukraine", "United Arab Emirates", "United Kingdom", "United States", "Uruguay", "Uzbekistan", "Vanuatu", "Vietnam", "Zambia", "Zimbabwe", "Japan", "Kazakhstan", "Mexico", "Norway", "Armenia", "Azerbaijan", "Cyprus", "Laos", "Russia", "Turkey", "East Timor", "Ecuador", "El Salvador", "Georgia", "Germany", "Haiti", "Honduras", "Iran", "Kazakhstan", "Malaysia", "Maldives", "Mauritania", "Poland", "Puerto Rico", "Samoa", "Serbia", "Switzerland", "Georgia"
    ],
    {label: "Country: "}
  )
);
We also need a bit of code that listens to changes in the dropdown menu and pushes changes to the chart.
if (countrySelect) {
    scatter.updateViz(`metadata.visualize.add-labels`, [countrySelect]);
    scatter.updateViz(`title`, `Income vs life expectancy in ${countrySelect} in 2021`);
    }
Finally, let's add a scatter-plot-updateable div to our HTML. This is where the chart will be insterted. For convenience, we'll also copy the countrySelect dropdown menu again.
<div id="scatter-plot-updateable"></div>
You can find a list of updateable properties on the Datawrapper website or see the properties of your own chart here (replace the ID with your chart ID).
Theoretically, you can use this method to create scrollable stories or animated charts.
Listening to chart interactions
Similarly to how you can update a chart based on user input outside the chart, you can also listen to interactions within the chart to update other parts of the page.
If you haven't already done so, import the necessary code.
import {Datawrapper} from '../src/datawrapper.js';
And as before, we'll add the ID of our Datawrapper chart and display it. We'll also add a tooltip div, which I'll explain below.
const scatterTooltips = new Datawrapper(scatterId, 'scatter-plot-tooltips');
<div id="scatter-plot-tooltips"></div>
<div id="tooltip"></div>
Now, we'll add a bit of code that listens for mouse events on the chart and displays a tooltip with data from the chart.
const tooltip = document.querySelector('#tooltip');

scatterTooltips.on('symbol.mouseenter', (data) => {
  tooltip.innerHTML = `<h3>Country: ${data.data.country}</h3>GDP per capita: ${data.data.gdp_per_capita_current_2021}<br>Life expectancy: ${data.data.life_expectancy_2021}`;
          tooltip.style.display = 'block';
});

scatterTooltips.on('symbol.mouseleave', (data) => {
  tooltip.style.display = 'none';
});
Now, when you hover over a scatterplot point, you should see a tooltip with the country name, GDP per capita, and life expectancy.
You can combine the two methods explained above to create a more interactive experience using just Datawrapper charts and a little bit of JavaScript.